Summarize with AI
BTC Price Prediction: What to Expect Today, Tomorrow and Over the Next 30 Days
| Date | Predicted Price | Change vs Today |
|---|---|---|
| Jul 2, 2026 | $61,044.27 | +1.98% |
| Jul 3, 2026 | $61,528.32 | +2.79% |
| Jul 4, 2026 | $61,966.15 | +3.52% |
| Jul 5, 2026 | $62,979.81 | +5.22% |
| Jul 6, 2026 | $64,016.66 | +6.95% |
| Jul 7, 2026 | $63,932.27 | +6.81% |
| Jul 8, 2026 | $62,579.13 | +4.55% |
| Jul 9, 2026 | $61,104.44 | +2.08% |
| Jul 10, 2026 | $60,394.50 | +0.90% |
| Jul 11, 2026 | $60,069.23 | +0.35% |
| Jul 12, 2026 | $59,312.23 | -0.91% |
| Jul 13, 2026 | $58,255.44 | -2.68% |
| Jul 14, 2026 | $57,936.44 | -3.21% |
| Jul 15, 2026 | $58,880.78 | -1.63% |
| Jul 16, 2026 | $60,386.74 | +0.89% |
| Jul 17, 2026 | $61,372.24 | +2.53% |
| Jul 18, 2026 | $61,721.74 | +3.12% |
| Jul 19, 2026 | $62,261.95 | +4.02% |
| Jul 20, 2026 | $63,314.06 | +5.78% |
| Jul 21, 2026 | $64,009.53 | +6.94% |
| Jul 22, 2026 | $63,377.62 | +5.88% |
| Jul 23, 2026 | $61,774.56 | +3.20% |
| Jul 24, 2026 | $60,472.51 | +1.03% |
| Jul 25, 2026 | $59,983.78 | +0.21% |
| Jul 26, 2026 | $59,637.13 | -0.37% |
| Jul 27, 2026 | $58,790.32 | -1.78% |
| Jul 28, 2026 | $57,938.29 | -3.21% |
| Jul 29, 2026 | $58,101.04 | -2.93% |
| Jul 30, 2026 | $59,411.34 | -0.74% |
| Jul 31, 2026 | $60,890.01 | +1.73% |
Bitcoin (BTC) trades at approximately $70,800 as of March 19, 2026, according to CoinGecko, down roughly 44% from its all-time high of $126,198, reached on October 6, 2025. The current correction follows a cycle pattern that has repeated across Bitcoin’s 17-year history: a post-halving bull run peaks, profit-taking sets in, and the asset enters a consolidation phase before the next accumulation cycle begins.
This analysis covers Bitcoin price predictions from 2026 through 2050. Every scenario uses the halving cycle as the primary forecasting framework, supplemented by on-chain metrics, institutional flow data, macroeconomic context, and published expert forecasts. Bitcoin price prediction models are analytical frameworks that forecast Bitcoin’s price trajectory through scarcity dynamics, adoption curves, and historical cycle analysis, none of which constitutes financial advice. The required disclaimer is at the end of this article.
- BTC Price Prediction: Today, Tomorrow and Next 30 Days
- Key takeaways – Bitcoin price predictions at a glance
- Understanding Bitcoin’s price drivers
- The Bitcoin halving cycle: foundation of price predictions
- Bitcoin’s historical performance analysis
- Current market analysis and on-chain metrics
- Bitcoin price prediction for 2026
- Bitcoin price prediction for 2027
- Bitcoin price prediction for 2028
- Bitcoin price prediction for 2029
- Bitcoin price prediction for 2030
- Bitcoin price prediction for 2031–2032
- Bitcoin price prediction for 2033–2035
- Long-term Bitcoin price predictions: 2040–2050
- Institutional adoption and Bitcoin ETF impact
- On-chain metrics: reading Bitcoin’s network health
- Stock-to-flow and prediction models analysis
- Expert predictions and institutional forecasts
- Regulatory landscape and policy impact
- Macro environment and Bitcoin as an inflation hedge
- Risk factors and bearish scenarios
- Investment strategy based on price predictions
- Conclusion: the future of Bitcoin pricing
- Frequently asked questions about Bitcoin price prediction
Key takeaways – Bitcoin price predictions at a glance
Bitcoin’s price trajectory from 2026 to 2050 is governed by one structural reality: programmed supply scarcity. Every four years, Bitcoin’s block reward halves, reducing the rate of new supply entering circulation. The April 2024 halving cut the reward from 6.25 BTC to 3.125 BTC per block. The next halving, expected in April 2028, will reduce it to 1.5625 BTC.
Historical post-halving performance provides the anchor for near-term predictions:
- 2012 halving → Bitcoin peaked +8,000% approximately 12 months later
- 2016 halving → Bitcoin peaked +2,800% approximately 17 months later
- 2020 halving → Bitcoin peaked +700% approximately 18 months later
- 2024 halving → Bitcoin peaked +240% at 481 days post-halving (October 2025 ATH of $126,198), per CoinGecko research
Expert predictions demonstrate a wide range of possible outcomes for Bitcoin’s future. Bullish analysts, including Cathie Wood of ARK Invest ($1M+ by 2030), Standard Chartered ($200K by 2027), and Bitwise CIO Matt Hougan ($1M within a decade), converge on institutional adoption as the primary driver. Conservative analysts, including Goldman Sachs ($75–100K for 2026), see macro conditions as the binding near-term constraint. Each cycle’s diminishing percentage returns are expected to continue as Bitcoin’s market capitalisation grows.
- Current BTC price: $59,856.89 as of today.
- 7-day change: +0.10% — upward momentum in the short term.
- Market sentiment: Fear & Greed Index at 11 — Extreme Fear.
- 30-day volatility: Moderate (-16.2% over 30 days). BTC remains subject to broad crypto market swings.
| Year | Bear case | Base case | Bull case |
|---|---|---|---|
| 2026 | $55K–$80K | $80K–$130K | $130K–$220K |
| 2027 | $70K–$110K | $130K–$260K | $260K–$450K |
| 2028 | $40K–$70K | $70K–$110K | $110K–$170K |
| 2030 | $80K–$130K | $150K–$300K | $300K–$600K |
| 2035 | $250K–$550K | $550K–$1M | $1M–$2M |
| 2040 | $500K–$1M | $1M–$3M | $3M–$10M |
| 2050 | $1M–$2M | $2M–$5M | $5M–$20M |
Understanding Bitcoin’s price drivers
Bitcoin’s price is shaped by five Market Influencing Factors, each carrying different weight depending on the market phase. Blockchain provides the foundational architecture for Bitcoin — a decentralised, immutable ledger that enables trustless peer-to-peer transactions without intermediaries, creating the technical basis for programmed scarcity and verifiable ownership that differentiates Bitcoin from all fiat assets.
Programmed scarcity is the foundational driver. Bitcoin’s maximum supply is capped at 21 million coins — of which approximately 20 million had entered circulation as of March 2026, according to CoinGecko. With roughly 1 million BTC remaining to be mined over the next 114 years, new supply growth is structurally declining. This differentiates Bitcoin from every fiat currency and from most other commodities.
Institutional adoption has become the second most significant Market Influencing Factor since January 2024. The SEC’s approval of 11 spot Bitcoin ETFs on January 10, 2024, opened Bitcoin exposure to pension funds, wealth managers, and institutional allocators through regulated, custodied products. Bitcoin ETF combined AUM had crossed $95 billion by early 2026, according to CoinMarketCap data.
Regulatory clarity determines institutional participation velocity. Macroeconomic environment influences risk appetite — Bitcoin has historically performed best during low-interest-rate periods and risk-on market conditions. On-chain metrics provide leading indicators: the Market Value to Realised Value (MVRV) ratio, exchange flow data, and HODL wave distributions reveal investor behaviour patterns that have historically preceded cycle tops and bottoms.
Each factor’s weight shifts across timeframes. Halving cycles dominate near-term prediction (30% weight). Institutional adoption drives medium-term trajectory (25%). Regulatory clarity determines institutional participation speed (20%). Macro environment governs short-term sentiment (15%). Network security underpins long-term survivability (10%).
The Bitcoin halving cycle: foundation of price predictions
The halving mechanism is built into Bitcoin’s code. Every 210,000 blocks — approximately every four years — Bitcoin Halving Events cut the reward miners receive per block by 50%. This directly impacts Bitcoin’s supply issuance rate, creating a predictable supply shock. Market Influencing Factors amplify or dampen halving effects depending on the demand environment at the time of each event.
The table below shows every halving to date with verified post-halving performance:
| Halving | Date | Reward before → after | Pre-halving price | Cycle peak | % gain | Months to peak |
|---|---|---|---|---|---|---|
| First | Nov 2012 | 50 → 25 BTC | ~$12 | ~$1,127 (Nov 2013) | +8,000% | 12 |
| Second | Jul 2016 | 25 → 12.5 BTC | ~$650 | ~$19,665 (Dec 2017) | +2,920% | 17 |
| Third | May 2020 | 12.5 → 6.25 BTC | ~$8,600 | ~$69,044 (Nov 2021) | +700% | 18 |
| Fourth | Apr 2024 | 6.25 → 3.125 BTC | ~$63,800 | ~$126,198 (Oct 2025) | ~+98% | 16 |
Three patterns are visible across these cycles. First, percentage returns diminish as Bitcoin’s market cap grows. Second, the time from halving to cycle peak has remained broadly consistent at 12–18 months. Third, each cycle’s bear market bottom has been substantially higher than the previous cycle’s bottom: $200 (2015), $3,200 (2018), $15,479 (2022). The fifth halving is expected in April 2028, reducing the block reward to 1.5625 BTC. By that point, approximately 99.6% of all Bitcoin will have been mined.
Key stats
All halvings
| Halving | Date | Block reward | Price at halving | Cycle peak | Gain | Time to peak |
|---|---|---|---|---|---|---|
| #1 — 2012 | Nov 2012 | 25 BTC | $12 | $1,150 | +57,000% | ~12 mo |
| #2 — 2016 | Jul 2016 | 12.5 BTC | $650 | $19,800 | +2,960% | ~17 mo |
| #3 — 2020 | May 2020 | 6.25 BTC | $8,600 | $69,000 | +702% | ~18 mo |
| #4 — 2024 | Apr 2024 | 3.125 BTC | $63,800 | $109,000+ | +70% (so far) | in progress |
| #5 — 2028 | ~Apr 2028 | 1.5625 BTC | — | — | — | — |
Post-halving gain by cycle
Each cycle gains are diminishing — market cap effect
Supply issuance per block
Each halving cuts new supply by 50%
Next halving countdown — est. April 2028
Block reward will drop from 3.125 → 1.5625 BTC · Est. block 1,050,000 · ~April 2028
Bitcoin's historical performance analysis
Bitcoin's Price History reveals key support and resistance levels that inform every near-term prediction. The 2022 bear market bottom of $15,479 established the lowest confirmed support in the current cycle; the 2021 peak of $69,044 and the 2025 ATH of $126,198 form the dominant resistance reference points. Bitcoin launched in January 2009 at a price near zero and has compounded at approximately 200% annually since inception despite multiple drawdowns exceeding 70%.
| Year | Notable event | Approximate range |
|---|---|---|
| 2013 | First mainstream ATH | $13 → $1,242 |
| 2014–15 | First extended bear market | $1,242 → $170 |
| 2017 | Second halving bull run | $1,000 → $19,665 |
| 2018 | Bear market | $19,665 → $3,200 |
| 2020–21 | Third halving + institutional entry | $3,200 → $69,044 |
| 2022 | Luna/FTX collapse + macro shock | $69,044 → $15,479 |
| 2023 | Recovery and ETF anticipation | $15,479 → $44,000 |
| 2024 | ETF approval + fourth halving | $44,000 → $106,000+ |
| 2025 | New ATH, then correction begins | $106,000 → $126,198 → ~$87,000 |
| 2026 (to date) | Continued correction | ~$87,000 → ~$70,800 |
The 2022 bear market was triggered by two overlapping shocks: the Terra/Luna collapse in May, which erased approximately $50 billion in market value within days, and the FTX collapse in November, which drove Bitcoin to $15,479. Both events revealed counterparty risks in centralised crypto infrastructure — not failures in Bitcoin's own network. The 2023 recovery was driven by spot ETF approval anticipation, closing the year near $44,000. January 11, 2024 — the date of spot ETF approval — marked a structural shift.
Bitcoin then reached $73,750 in March 2024, its first new ATH since 2021, before the fourth halving in April 2024. The subsequent bull run carried Bitcoin to $126,198 in October 2025 — 481 days post-halving, matching the historical average per CoinGecko research. The Bitcoin Halving Events market cycle structure has defined each major bull and bear phase since 2012.
Notable 2026 milestones (as of March 2026):
- Bitcoin's circulating supply crossed 20 million BTC in March 2026 — leaving approximately 1 million BTC to be mined over the next ~114 years, per CoinGecko
- Bitcoin dominance at approximately 58%, per CoinDCX analysis, March 2026
- Spot Bitcoin ETF combined AUM near $95.7 billion, per CoinMarketCap
- MicroStrategy purchased 3,015 BTC at $67,700 per coin on March 2, 2026, per public filings
- Bitwise CIO Matt Hougan publicly stated on March 11, 2026 that Bitcoin could reach $1,000,000 within a decade if it captures ~17% of the global store-of-value market, up from ~4% currently
| Month | Open | High | Low | Close | Change |
|---|---|---|---|---|---|
| Jan 2024 | $42,000.00 | $48,200.00 | $38,500.00 | $46,200.00 | +10.0% |
| Feb 2024 | $46,200.00 | $57,300.00 | $43,800.00 | $56,800.00 | +22.9% |
| Mar 2024 | $56,800.00 | $73,750.00 | $56,500.00 | $71,200.00 | +25.4% |
| Apr 2024 | $71,200.00 | $72,800.00 | $56,500.00 | $60,800.00 | -14.6% |
| May 2024 | $60,800.00 | $72,600.00 | $56,500.00 | $68,300.00 | +12.3% |
| Jun 2024 | $68,300.00 | $72,000.00 | $58,500.00 | $62,700.00 | -8.2% |
| Jul 2024 | $62,700.00 | $70,000.00 | $53,500.00 | $66,100.00 | +5.4% |
| Aug 2024 | $66,100.00 | $66,400.00 | $49,000.00 | $59,200.00 | -10.4% |
| Sep 2024 | $59,200.00 | $65,800.00 | $54,800.00 | $63,400.00 | +7.1% |
| Oct 2024 | $63,400.00 | $73,900.00 | $59,600.00 | $73,600.00 | +16.1% |
| Nov 2024 | $73,600.00 | $99,700.00 | $68,300.00 | $97,300.00 | +32.2% |
| Dec 2024 | $97,300.00 | $108,400.00 | $89,000.00 | $93,200.00 | -4.2% |
| Month | Open | High | Low | Close | Change |
|---|---|---|---|---|---|
| Jan 2025 | $93,200.00 | $109,000.00 | $89,000.00 | $105,000.00 | +12.7% |
| Feb 2025 | $105,000.00 | $108,000.00 | $78,200.00 | $84,200.00 | -19.8% |
| Mar 2025 | $84,200.00 | $92,500.00 | $77,000.00 | $82,500.00 | -2.0% |
| Apr 2025 | $82,500.00 | $95,800.00 | $74,500.00 | $94,200.00 | +14.2% |
| May 2025 | $94,200.00 | $112,000.00 | $93,000.00 | $107,000.00 | +13.6% |
| Jun 2025 | $107,000.00 | $112,000.00 | $96,000.00 | $98,500.00 | -7.9% |
| Jul 2025 | $98,500.00 | $112,500.00 | $95,000.00 | $98,000.00 | -0.5% |
| Aug 2025 | $98,000.00 | $109,000.00 | $90,500.00 | $96,200.00 | -1.8% |
| Sep 2025 | $96,200.00 | $99,000.00 | $82,000.00 | $85,500.00 | -11.1% |
| Oct 2025 | $85,500.00 | $98,000.00 | $83,000.00 | $95,500.00 | +11.7% |
| Nov 2025 | $95,500.00 | $99,800.00 | $87,000.00 | $91,200.00 | -4.5% |
| Dec 2025 | $91,200.00 | $98,500.00 | $83,000.00 | $87,000.00 | -4.6% |
Current market analysis and on-chain metrics
Bitcoin's current market structure as of March 2026 reflects a mid-cycle correction following the October 2025 peak. On-Chain Metrics is a category of blockchain-native data that provides leading indicators unavailable in traditional financial markets — because Bitcoin's blockchain is public, every transaction is observable, enabling real-time analysis of investor behaviour and network health.
The MVRV ratio (Market Value / Realised Value) measures whether Bitcoin is trading above or below the aggregate cost basis of all holders. Historically, MVRV readings above 3.5 have coincided with cycle tops; readings below 1.0 have coincided with cycle bottoms. At the October 2025 peak near $126,000, MVRV readings were elevated relative to long-term averages — consistent with prior cycle tops. As of March 2026, Bitcoin trades near estimated miner production costs of approximately $70,000, a level that has historically coincided with miner capitulation phases.
Bitcoin ETFs with combined AUM near $95.7 billion represent sustained institutional participation absent from prior cycles. This persistent institutional bid has affected the floor dynamics of the current correction — Bitcoin's drawdown from ATH is approximately 44%, shallower than the 77% drawdown of 2022 from the same relative position in its cycle.

[картинка gauge от Alternative.me] ← красивая, профессиональная
[текст: "Fear & Greed Index: 13 — Extreme Fear"] ← Google индексирует
| Metric | What it measures | Top signal | Bottom signal |
|---|---|---|---|
| MVRV ratio | Market value vs. cost basis of all holders | Above 3.5 historically | Below 1.0 historically |
| NVT ratio | Network value vs. transaction volume | High = overvalued | Low = undervalued |
| SOPR | Profit/loss on spent outputs | Extreme profit-taking | Loss realisation |
| Exchange flows | Net BTC moving to/from exchanges | Net inflows (selling) | Net outflows (accumulation) |
| HODL waves | Supply held by long-term vs. short-term holders | Short-term concentration | Long-term concentration |
Technical Analysis Indicators identify Bitcoin entry and exit points through support/resistance zones, moving averages, and momentum signals. Bitcoin has faced overhead resistance near the $74K–$75K zone as of March 2026, per CoinDCX analysis. A confirmed breakout above $100,000–$105,000 would signal re-entry into price discovery. The 200-day moving average is rising, indicating the underlying trend remains intact.
A significant share of Bitcoin supply has not moved in over a year, per on-chain data from March 2026 — indicating long-term holder conviction through the correction.
| Current price | $70,600 |
| Resistance: order block 2 | $86,000 – $90,600 |
| Resistance: order block 1 | $74,567 – $79,289 |
| STH cost basis | $70,000 |
| Support: key floor | $62,300 |
| Support: Fibonacci | $56,800 |
| Support: deep correction | $47,800 |
| Change of character (bullish) | $97,900 |
| All-time high (Oct 6, 2025) | $126,198 |
Bitcoin price prediction for 2026
Context: March 2026 sits approximately 23 months post-April 2024 halving. Historical cycles suggest this period represents either late-stage correction or early-stage recovery, depending on whether the October 2025 peak represents the full cycle top. Bitcoin Halving Events historically trigger bull markets 12–18 months after the event — making 2026 a pivotal transition year.
The primary question for 2026 is whether Bitcoin's cycle peaked in October 2025 — earlier and at a lower multiple than prior cycles — or whether a second leg higher is possible later in 2026 or into 2027. Expert Predictions provide a credibility range: Goldman Sachs ($75–100K for 2026) represents the conservative anchor; Standard Chartered ($200K by 2027) and Raoul Pal ($250K–$500K bull case) represent the upper range.
Technical Analysis Indicators identify $74K–$75K as the near-term resistance zone and $65K–$68K as the key support level. A sustained break above $100,000–$105,000 would signal trend reversal; a break below $60,000 would indicate the bear case materialising.
| Scenario | Annual range | Key condition |
|---|---|---|
| Bear | $55K–$80K | Extended macro headwinds, no ETF flow recovery, $100K resistance holds all year |
| Base | $80K–$130K | ETF inflows stabilise then recover, macro conditions improve, $100K reclaimed by Q4 |
| Bull | $130K–$220K | ETF inflows reaccelerate strongly, rate cuts materialise, second bull leg develops |
| Month 2026 | Min | Avg | Max | ROI vs Now |
|---|---|---|---|---|
| Jan | $55,458.18 | $60,328.40 | $65,198.63 | +2.8% |
| Feb | $54,968.00 | $62,043.91 | $69,119.83 | +5.8% |
| Mar | $56,402.45 | $63,808.20 | $71,213.95 | +8.8% |
| Apr | $60,049.82 | $65,622.66 | $71,195.51 | +11.9% |
| May | $60,014.80 | $67,488.72 | $74,962.64 | +15.1% |
| Jun | $61,207.72 | $69,407.84 | $77,607.95 | +18.3% |
| Jul | $64,923.27 | $71,381.53 | $77,839.79 | +21.7% |
| Aug | $65,569.23 | $73,411.35 | $81,253.47 | +25.1% |
| Sep | $66,479.65 | $75,498.88 | $84,518.11 | +28.7% |
| Oct | $70,205.90 | $77,645.78 | $85,085.66 | +32.4% |
| Nov | $71,679.22 | $79,853.73 | $88,028.24 | +36.1% |
| Dec | $72,270.37 | $82,124.46 | $91,978.56 | +40.0% |
Key catalysts to monitor in 2026:
- U.S. CLARITY Act progress — regulatory clarity could unlock institutional capital currently on the sidelines
- ETF flow reacceleration — weekly net inflows returning to positive after recent outflows
- BTC reclaiming $100,000 — psychological level triggering momentum-driven buying
- The crypto industry gained first access to the Federal Reserve payment system on March 5, 2026, signalling deepening institutional integration
Bitcoin price scenarios — 2026 quarterly targets
| Scenario | Q1 2026 | Q2 2026 | Q3 2026 | Q4 2026 |
|---|---|---|---|---|
| Bull | $95K – $110K | $120K – $145K | $155K – $185K | $200K – $250K |
| Base | $82K – $95K | $88K – $108K | $100K – $125K | $115K – $145K |
| Bear | $65K – $80K | $55K – $70K | $48K – $62K | $40K – $55K |
Analyst consensus aggregates. Not investment advice.
Bitcoin price prediction for 2027
Context: 2027 sits approximately 36 months post-April 2024 halving. Historical 2017 and 2021 cycles both peaked between 30 and 36 months post-halving, placing 2027 as the most likely candidate year for a new cycle peak if the October 2025 ATH was not the full cycle top.
Expert Predictions for 2027 show meaningful convergence: Standard Chartered targets $200,000, Raoul Pal's base case is $250,000–$300,000, and the PlanB Stock-to-Flow model implies a similar range. The analogy from prior cycles is instructive — the 2017 peak came 30 months post-2016 halving; the 2021 peak came 18 months post-2020 halving. Bitcoin Halving Events have historically triggered bull markets within this 18–36 month window.
| Scenario | Annual range | Key condition |
|---|---|---|
| Bear (20%) | $70K–$110K | 2026 represented the early cycle top; 2027 is consolidation/recovery |
| Base (50%) | $130K–$260K | Classic cycle extension; peak Q1–Q2, distribution H2; target $200–250K peak |
| Bull (30%) | $260K–$450K | Extended cycle, institutional demand overwhelms; $400K+ possible |
| Month | Low | Average | High |
|---|---|---|---|
| January | $110,000 | $128,000 | $150,000 |
| February | $118,000 | $138,000 | $165,000 |
| March | $125,000 | $148,000 | $178,000 |
| April | $130,000 | $155,000 | $185,000 |
| May | $140,000 | $168,000 | $200,000 |
| June | $150,000 | $180,000 | $215,000 |
| July | $160,000 | $192,000 | $230,000 |
| August | $165,000 | $198,000 | $240,000 |
| September | $158,000 | $190,000 | $235,000 |
| October | $148,000 | $178,000 | $220,000 |
| November | $135,000 | $162,000 | $200,000 |
| December | $125,000 | $150,000 | $185,000 |
Bitcoin price scenarios — 2027 quarterly targets
| Scenario | Q1 2027 | Q2 2027 | Q3 2027 | Q4 2027 |
|---|---|---|---|---|
| Bull30% | $260K – $320K | $340K – $450K | $280K – $380K | $260K – $320K |
| Base50% | $155K – $200K | $200K – $260K | $160K – $220K | $130K – $180K |
| Bear20% | $85K – $110K | $80K – $105K | $75K – $100K | $70K – $95K |
Speculative base-case estimates. Not financial advice.
Bitcoin price prediction for 2028
Context: The fifth Bitcoin halving is expected in April 2028, reducing the block reward from 3.125 BTC to 1.5625 BTC per block — a Bitcoin Halving Event that will occur in April 2028, with the block reward halving representing the most structurally significant supply-side event of the next four-year cycle. By that point, 99.6% of all Bitcoin will have been mined.
2028 will likely be a year of transition: post-2027 cycle correction in the first half, followed by halving-driven stabilisation in the second half. Market Influencing Factors that determine the correction depth include the magnitude of the 2027 peak, the macroeconomic environment (recession timing), institutional holding behaviour during drawdowns, and regulatory developments.
| Scenario | Annual range | Key condition |
|---|---|---|
| Bear (25%) | $40K–$70K | Deep correction from 2027 peak; halving fails to arrest decline in 2028 |
| Base (55%) | $70K–$110K | Healthy correction; halving provides floor; recovery begins Q3–Q4 |
| Bull (20%) | $110K–$170K | Shallow correction; institutional bid holds; elevated consolidation throughout |
Block reward will drop from 3.125 → 1.5625 BTC · Est. block 1,050,000 · ~April 2028
| Month | Low | Average | High |
|---|---|---|---|
| January | $100,000 | $115,000 | $132,000 |
| February | $90,000 | $103,000 | $118,000 |
| March | $82,000 | $93,000 | $107,000 |
| April (halving) | $75,000 | $86,000 | $99,000 |
| May | $72,000 | $83,000 | $96,000 |
| June | $70,000 | $81,000 | $93,000 |
| July | $73,000 | $84,000 | $97,000 |
| August | $78,000 | $89,000 | $103,000 |
| September | $83,000 | $95,000 | $110,000 |
| October | $87,000 | $100,000 | $116,000 |
| November | $90,000 | $104,000 | $120,000 |
| December | $92,000 | $107,000 | $124,000 |
Bitcoin price prediction for 2029
Context: Year 1 post-2028 halving. Bitcoin Price Prediction models based on historical Year 1 post-halving patterns (2013, 2017, 2021) consistently show accumulation and base-building rather than immediate parabolic moves. The rally typically begins in Year 2 post-halving, making 2029 the most significant accumulation window before the anticipated 2030–2031 bull phase.
| Scenario | Annual range | Year-end target |
|---|---|---|
| Bear (20%) | $50K–$80K | $65–75K |
| Base (60%) | $100K–$150K | $120–140K — positioning for 2030 rally |
| Bull (20%) | $150K–$200K | $170–190K — early bull cycle initiation |
| Month | Low | Average | High |
|---|---|---|---|
| January | $93,000 | $108,000 | $125,000 |
| February | $95,000 | $110,000 | $128,000 |
| March | $97,000 | $113,000 | $131,000 |
| April | $98,000 | $114,000 | $133,000 |
| May | $99,000 | $115,000 | $134,000 |
| June | $100,000 | $116,000 | $136,000 |
| July | $103,000 | $120,000 | $140,000 |
| August | $107,000 | $124,000 | $145,000 |
| September | $110,000 | $128,000 | $150,000 |
| October | $114,000 | $133,000 | $156,000 |
| November | $117,000 | $136,000 | $160,000 |
| December | $120,000 | $140,000 | $165,000 |
If historical accumulation patterns repeat, 2029 represents the last major accumulation window before the 2030–2031 rally phase. Key metrics indicating accumulation: MVRV ratio below 1.5, sustained exchange outflows, and HODL waves showing long-term holders increasing their share of supply.
Pattern analysis for educational purposes only. Past cycles do not guarantee future behaviour. Not financial advice.
Bitcoin price prediction for 2030
Context: Year 2 post-2028 halving. Bitcoin's most bullish periods in prior cycles arrived approximately 18–24 months post-halving (2013, 2017, 2021). 2030 aligns precisely with that historical window. The Bitcoin Halving Event supply effect peaks at approximately 24 months post-event, historically corresponding with the most intense phase of the bull cycle.
Expert Predictions converge around $200K–$500K for 2030: Cathie Wood of ARK Invest publicly projected $1 million or above by 2030 based on institutional adoption curves; JP Morgan has cited $150,000 based on their institutional allocation thesis; Standard Chartered's $200,000 by 2027 target implies further upside from that level into 2030. Market Influencing Factors align bullishly in 2030: over 90% of all Bitcoin mined, halving supply shock propagating, institutional adoption compounding.
| Scenario | Q1 | Q2 | Q3 | Q4 |
|---|---|---|---|---|
| Bear (15%) | $80K–$110K | $90K–$115K | $95K–$120K | $100K–$125K |
| Base (60%) | $145K–$175K | $170K–$215K | $210K–$265K | $240K–$305K |
| Bull (25%) | $280K–$340K | $340K–$435K | $430K–$530K | $490K–$600K |
| Month | Low | Average | High |
|---|---|---|---|
| January | $145,000 | $165,000 | $190,000 |
| February | $155,000 | $178,000 | $205,000 |
| March | $165,000 | $190,000 | $220,000 |
| April | $175,000 | $202,000 | $235,000 |
| May | $185,000 | $215,000 | $250,000 |
| June | $192,000 | $222,000 | $260,000 |
| July | $200,000 | $233,000 | $272,000 |
| August | $208,000 | $242,000 | $283,000 |
| September | $215,000 | $250,000 | $292,000 |
| October | $222,000 | $258,000 | $300,000 |
| November | $218,000 | $253,000 | $295,000 |
| December | $214,000 | $248,000 | $290,000 |
Speculative base-case estimates. Not financial advice.
Key catalysts for the 2030 base case: nation-state Bitcoin reserve adoption expanding beyond El Salvador; Fortune 500 corporate treasury adoption reaching critical mass; ETF inflows compounding (1% of global institutional AUM represents approximately $500 billion in new demand); supply scarcity acute as over 90% of all Bitcoin will have been mined.
Bitcoin price scenarios — 2030 quarterly targets
| Scenario | Q1 2030 | Q2 2030 | Q3 2030 | Q4 2030 |
|---|---|---|---|---|
| Bull25% | $280K – $340K | $340K – $435K | $430K – $530K | $490K – $600K |
| Base60% | $145K – $175K | $170K – $215K | $210K – $265K | $240K – $305K |
| Bear15% | $80K – $110K | $90K – $115K | $95K – $120K | $100K – $125K |
Speculative base-case estimates. Not financial advice.
Bitcoin price prediction for 2031–2032
2031 — Post-2030 peak correction. The Bitcoin cycle pattern that has defined every major bear market positions 2031 as a post-peak consolidation year. Market Influencing Factors determining correction depth: the magnitude of the 2030 peak, institutional holding behaviour during drawdowns, and whether the four-year cycle structure persists as fee economics begin to replace block subsidy as the primary miner incentive.
| Scenario | 2031 range | Key dynamic |
|---|---|---|
| Bear | $80K–$150K | Major correction from $300K+ peak; extended consolidation |
| Base | $150K–$250K | Healthy consolidation; higher lows than 2028; accumulation building |
| Bull | $250K–$400K | Extended cycle; shallow correction; institutions hold through weakness |
2032 — Sixth halving (April 2032 expected) + pre-halving accumulation. The sixth Bitcoin Halving Event will occur in approximately April 2032, reducing the block reward to 0.78125 BTC. By this point, over 99.8% of Bitcoin's total supply will be in circulation. Transaction fees become increasingly important for miner economics as block subsidy approaches negligibility.
| Scenario | 2032 range | Key dynamic |
|---|---|---|
| Bear | $100K–$180K | Extended bear recovery; halving fails to provide early catalyst |
| Base | $200K–$350K | Pre-halving rally initiating in H2 2032; institutional accumulation |
| Bull | $350K–$500K | Early positioning for halving cycle; anticipation at elevated levels |
Key consideration for 2031–2032: by this period, Bitcoin may be establishing itself as an institutional standard — volatility compressing, ETF AUM potentially exceeding $500 billion, and the four-year cycle structure potentially lengthening or dampening as the asset matures.
Bitcoin two-year outlook — 2031–2032
2031 — post-peak correction year
| Scenario | Annual range | Key dynamic |
|---|---|---|
| Bull | $250K – $400K | Extended cycle; shallow correction; institutions hold |
| Base | $150K – $250K | Healthy consolidation; higher lows than 2028 |
| Bear | $80K – $150K | Major correction from $300K+ peak; extended consolidation |
2032 — sixth halving Halving ~Apr 2032
| Scenario | Annual range | Key dynamic |
|---|---|---|
| Bull | $350K – $500K | Early positioning for halving; anticipation at elevated levels |
| Base | $200K – $350K | Pre-halving rally initiating H2 2032; institutional accumulation |
| Bear | $100K – $180K | Extended bear recovery; halving fails to provide early catalyst |
Speculative long-range estimates. Not financial advice.
Bitcoin price prediction for 2033–2035
Extended mid-term forecast covering the post-2032 halving cycle. At 7–9 year horizons, structural adoption trends carry more predictive weight than specific price targets. Bitcoin Price Prediction Models at this timeframe produce a wide range — the Power Law model implies $400,000–$800,000 by 2034, while the Stock-to-Flow model implies $500,000–$1.5 million. The uncertainty band widens materially beyond 5 years.
| Year | Conservative | Base | Optimistic |
|---|---|---|---|
| 2033 | $200K–$400K | $400K–$800K | $800K–$1.5M |
| 2034 | $250K–$500K | $500K–$900K | $900K–$1.6M |
| 2035 | $250K–$550K | $550K–$1M | $1M–$2M |
Key assumptions underlying the base case: continued institutional adoption, regulatory clarity expanding globally, no major protocol failures, and Bitcoin maintaining its dominant store-of-value position. Expert Predictions demonstrate wide variability at these timeframes — directional consensus is stronger than specific numbers.
The 2036 halving (expected) will reduce the block reward to approximately 0.39 BTC. At that point, Bitcoin's annualised inflation rate will fall below 0.2% — lower than any fiat currency in history, reinforcing the scarcity narrative that underpins the long-term bull case.
BTC supply assumed at 21M. Traditional asset values are approximate and subject to change. Not financial advice.
Long-term Bitcoin price predictions: 2040–2050
These projections carry very high uncertainty. They are included because the structural logic of Bitcoin's terminal value case merits discussion — not because specific numbers are predictable at 15–25 year horizons.
2040 scenarios
By 2040, approximately 12 Bitcoin Halving Events will have completed. Bitcoin's daily new supply will be negligible — approximately 0.01 BTC per block. The store-of-value thesis will either have been validated at scale or displaced by a superior alternative. Market Influencing Factors at this timeframe shift decisively toward adoption breadth and regulatory environment, with halving cycles playing a diminishing structural role.
| Scenario | 2040 range | Implied market cap | Narrative |
|---|---|---|---|
| Bear | $500K–$1M | ~$10T–$20T | Bitcoin survives as a niche store of value; gold retains dominance |
| Base | $1M–$3M | ~$20T–$60T | Digital gold thesis validated; 5–10% of gold's value share captured |
| Bull | $3M–$10M | ~$60T–$200T | Global reserve asset trajectory; central bank holdings standard |
Context: gold's total market capitalisation was approximately $20 trillion as of late 2025. Bitcoin's market cap was approximately $1.4 trillion as of March 2026 — roughly 7% of gold's value. Bitwise CIO Matt Hougan's March 2026 $1 million target thesis is based on Bitcoin capturing ~17% of the global store-of-value market from its current ~4% position.
2050 scenarios
| Scenario | 2050 range | Key requirement |
|---|---|---|
| Bear | $1M–$2M | Bitcoin survives but growth decelerates sharply after 2040 |
| Base | $2M–$5M | Digital gold parity achieved; new ATHs continue but at lower multiples |
| Bull | $5M–$20M | Global reserve standard; Bitcoin surpasses gold market cap |
What needs to go right for the base case: Bitcoin's security model remains intact; no superior decentralised store of value displaces its network effects; regulatory acceptance continues to expand globally; transaction fee economics sustain miner incentives as block subsidy approaches zero. What could prevent these outcomes: quantum computing advances faster than quantum-resistant protocol solutions are implemented; coordinated G20-level regulatory ban; unforeseen protocol-level security breach.
Analysis based on publicly stated risk factors. Directional consensus stronger than specific price targets at 25-year horizons. Not financial advice.
Institutional adoption and Bitcoin ETF impact
Bitcoin ETFs — exchange-traded funds holding Bitcoin directly for institutional and retail investors — increased institutional exposure to Bitcoin through mainstream regulated channels at a scale not previously possible. The January 10, 2024, SEC approval of 11 spot Bitcoin ETFs was the single most structurally significant development in Bitcoin's history since the 2017 scaling debates.
Within approximately 12 months of approval, Bitcoin spot ETF AUM exceeded $95 billion per CoinMarketCap data. By comparison, gold ETFs took approximately five years to accumulate equivalent AUM. This pace reflects accumulated institutional demand that existed but lacked a compliant access vehicle.
Institutional allocation math: if 1% of global institutional AUM (estimated $50 trillion) flows into Bitcoin, that represents approximately $500 billion in new demand against a circulating supply of 20 million BTC. If 5% flows in, that represents $2.5 trillion in new demand. Neither outcome is guaranteed, but the infrastructure to enable both now exists in a way it did not before 2024.
Corporate treasury adoption has accelerated alongside ETF growth. MicroStrategy held over 500,000 BTC as of March 2026, per public filings. The company's March 2, 2026 purchase of 3,015 BTC at $67,700 per coin demonstrates continued accumulation strategy even at correction-phase prices. The persistent institutional bid through Bitcoin ETFs has affected floor dynamics — Bitcoin's current drawdown (~44% from ATH) is structurally shallower than the 2022 drawdown (~77%) from the same relative cycle position.
On-chain metrics: reading Bitcoin's network health
On-Chain Metrics provide leading indicators unavailable in traditional financial markets. Because Bitcoin's blockchain is public, every transaction is observable. These metrics track investor behaviour patterns in real time, allowing analysts to identify accumulation and distribution phases with a degree of precision impossible in traditional equity or commodity markets.
| Metric | What it measures | Top signal | Bottom signal |
|---|---|---|---|
| MVRV ratio | Market value vs. cost basis of all holders | Above 3.5 historically | Below 1.0 historically |
| NVT ratio | Network value vs. transaction volume | High = overvalued | Low = undervalued |
| SOPR | Profit/loss on spent outputs | Extreme profit-taking | Loss realisation |
| Exchange flows | Net BTC moving to/from exchanges | Net inflows (selling) | Net outflows (accumulation) |
| HODL waves | Supply held by long-term vs. short-term holders | Short-term concentration | Long-term concentration |
Historical applications: At the November 2021 cycle top (~$69,000), the MVRV ratio reached approximately 4.0, exchange inflows spiked, and SOPR showed extreme profit-taking — all three signals aligned to indicate a top. At the November 2022 bear market bottom (~$15,479), the MVRV ratio dropped to approximately 0.8, exchange outflows resumed, and long-term holder HODL waves showed continued accumulation despite price weakness.
Technical Indicators complement on-chain analysis by identifying historical price levels that function as support and resistance. Bitcoin's Price History reveals that the $15,479 2022 bottom, the $69,044 2021 peak, and the $126,198 2025 ATH are the three most significant levels in the current cycle — support/resistance zones derived directly from on-chain-confirmed distribution and accumulation events.
Current March 2026 interpretation: Bitcoin trades near estimated miner production costs (~$70,000), a range historically associated with miner capitulation and reduced new supply reaching exchanges — conditions that have preceded accumulation phases in prior cycles.
Signal values sourced from publicly cited on-chain data. Past signals do not guarantee future accuracy. Not financial advice.
Stock-to-flow and prediction models analysis
Bitcoin Price Prediction Models are analytical frameworks that forecast Bitcoin's price trajectory through distinct methodologies — each with measurable historical accuracy and specific failure modes. Understanding these models' assumptions is as important as knowing their outputs.
| Model | Methodology | 2026 target | 2030 target | Key limitation |
|---|---|---|---|---|
| Stock-to-Flow (PlanB) | Scarcity ratio drives value; modelled after gold/silver | ~$100K | ~$500K–$1M | Ignores demand side; no failure mechanism |
| Power Law | Bitcoin follows logarithmic regression over time | ~$80–120K | ~$200K | Assumes trend continuity; no black swan accommodation |
| Rainbow Chart | Colour-coded logarithmic regression bands | N/A (timing tool) | N/A | Direction not price-specific |
| 4-Year Cycle model | Halving cycle as primary structuring mechanism | Post-ATH correction | $150–300K | Diminishing returns as market matures |
The Stock-to-Flow model (PlanB) divides Bitcoin's total stock by its annual flow (new supply mined per year). Historical accuracy was strong through three halvings (2012–2021); the model underperformed during the 2022–2023 bear market, suggesting demand-side variables can temporarily override scarcity-based predictions. The Power Law model produces more conservative targets, implying approximately $200,000 by 2030 and $1 million by 2040.
Practical weighting: no single model accurately predicts Bitcoin's price in isolation. The most defensible approach treats models as frameworks for directional thinking, maintaining substantial weight (40–50%) on demand-side variables that quantitative models systematically underweight. Expert Predictions that cite model outputs without disclosing methodological assumptions should be weighted lower than those with transparent reasoning.
| Model | Methodology | 2026 target | 2030 target | Accuracy |
|---|---|---|---|---|
| Stock-to-Flow Mixed post-2022 | Scarcity ratio drives value; modelled after gold & silver dynamics | ~$100K | $500K – $1M | Strong 2012–2021; underperformed 2022–23 bear market |
| Power Law Conservative | Bitcoin follows logarithmic price regression over long time horizons | $80K – $120K | ~$200K | Assumes trend continuity; no black swan accommodation |
| Rainbow Chart Timing tool | Colour-coded logarithmic regression bands indicating over/undervaluation zones | N/A — timing only | N/A — timing only | Direction not price-specific; no precise targets |
| 4-Year Cycle Diminishing | Halving cycle as primary structuring mechanism; post-halving bull/bear patterns | Post-ATH correction | $150K – $300K | Diminishing returns as market matures; cycle length may extend |
No single model accurately predicts Bitcoin's price in isolation. Models should be treated as directional frameworks, not precise forecasts. Not financial advice.
Expert predictions and institutional forecasts
Expert Predictions provide credibility to Bitcoin price forecasts by demonstrating the range of possible outcomes across distinct analytical frameworks. The table below compares notable predictions with their stated methodologies. Assessments are attributed to publicly reported positions.
| Analyst / Institution | 2026–27 target | 2030 target | Methodology basis | Assessment |
|---|---|---|---|---|
| Cathie Wood, ARK Invest | Not specified | $1M+ | Institutional adoption curves | Bullish — track record includes correct 2020 cycle call |
| Michael Saylor, MicroStrategy | Long-term | $1M–$5M | Bitcoin as digital property | Bullish — large personal holding creates selection bias |
| Raoul Pal, Real Vision | $250K–$500K | Not specified | Macro liquidity cycle analysis | Bullish-moderate — transparent macro framework |
| PlanB (S2F model) | ~$100K (2026) | ~$500K (2029) | Scarcity-based model | Model-driven — accurate 2012–2021; underperformed 2022 |
| JP Morgan | ~$150K | Not specified | Institutional allocation thesis | Moderate — institutional participation-dependent |
| Standard Chartered | ~$200K (2027) | Not specified | ETF flows compounding | Moderate — ETF adoption pace-dependent |
| Bitwise (Matt Hougan) | $1M within decade | $1M (stated Mar 2026) | 17% store-of-value market share | Bullish — specific mechanism cited (March 11, 2026) |
| Goldman Sachs | $75K–$100K (2026) | Not specified | Macro and institutional thesis | Conservative — represents bear/cautious anchor |
| Peter Schiff | Failure (ongoing) | N/A | Bitcoin lacks intrinsic value thesis | Bearish — consistent critic; contrarian indicator historically |
Three patterns emerge across forecasts. Bullish forecasters converge around institutional adoption and fixed supply as the primary long-term drivers. Moderate forecasts ($100K–$200K for 2026–2027) focus on near-term cycle positioning and ETF flow sustainability. Bearish voices — Goldman Sachs ($75–100K) and Peter Schiff (persistent failure thesis) — represent the lower bound of the opinion spectrum and the contrarian-indicator baseline.
| Analyst / Institution | 2026–27 target | 2030 target | Methodology | Assessment |
|---|---|---|---|---|
| Cathie WoodARK Invest | Not specified | $1M+ | Institutional adoption curves | Bullish Correct 2020 cycle call |
| Michael SaylorMicroStrategy | Long-term hold | $1M – $5M | Bitcoin as digital property | Bullish Large personal holding; selection bias |
| Raoul PalReal Vision | $250K – $500K | Not specified | Macro liquidity cycle analysis | Bullish–moderate Transparent macro framework |
| PlanBS2F model | ~$100K (2026) | ~$500K (2029) | Scarcity-based S2F model | Model-driven Accurate 2012–2021; underperformed 2022 |
| JP MorganInstitutional | ~$150K | Not specified | Institutional allocation thesis | Moderate Participation-dependent |
| Standard CharteredInstitutional | ~$200K (2027) | Not specified | ETF flows compounding | Moderate ETF adoption pace-dependent |
| Matt HouganBitwise | $1M within decade | $1M (Mar 2026) | 17% store-of-value market share | Bullish Specific mechanism cited Mar 2026 |
| Goldman SachsInstitutional | $75K – $100K | Not specified | Macro and institutional thesis | Conservative Bear/cautious anchor |
| Peter SchiffEuro Pacific Capital | Failure thesis | N/A | Bitcoin lacks intrinsic value | Bearish Consistent critic; contrarian indicator |
All figures are individual opinions based on publicly reported statements. Not financial advice.
Regulatory landscape and policy impact
Regulatory developments represent the single largest external uncertainty for Bitcoin's price trajectory across all timeframes. Market Influencing Factors driven by regulation differ from halving or macro factors — regulatory changes can materialise suddenly with outsized price impact in both directions.
| Region | Regulatory stance (March 2026) |
|---|---|
| USA | Spot ETFs approved January 2024; CLARITY Act under discussion; political acceptance growing; crypto industry gained Federal Reserve payment system access March 5, 2026 |
| EU | MiCA framework in effect; provides legal clarity for crypto businesses; most material regulatory development in 2025–2026 |
| Hong Kong | Pro-crypto; actively building regulated crypto market |
| Japan | Established framework; institutional participation growing |
| China | Mining and trading banned since 2021; no near-term reversal signals |
Impact precedents: The January 2024 ETF approval drove Bitcoin from approximately $40,000 to $73,750 within two months — demonstrating positive regulatory events can catalyse material price moves quickly. China's 2021 mining ban caused a temporary 50% correction; Bitcoin recovered to new ATHs within months. Regulatory news moves prices short-term; the structural trend is shaped by whether institutions can participate legally at scale.
Regulatory stance as of March 2026. Subject to change. Not financial advice.
Macro environment and Bitcoin as an inflation hedge
Bitcoin's relationship with macroeconomic variables is real but more nuanced than the 'digital gold' narrative suggests. Market Influencing Factors in the macro environment operate on a multi-year horizon for Bitcoin — short-term correlations to risk assets can diverge sharply from the long-term scarcity thesis.
The scarcity thesis in context: Bitcoin's 21-million-coin maximum supply is structurally analogous to gold's finite stock. Between 2020 and 2021, U.S. M2 money supply expanded by approximately 26%, according to Federal Reserve H.6 Money Stock data (2021). During the same period, Bitcoin rose approximately 700%. The inflation-hedge function operates across multi-year horizons — in 2022, when U.S. CPI hit 9.1% (Bureau of Labor Statistics, June 2022), Bitcoin fell 77% as rising interest rates drove a risk-off environment.
The gold comparison: Bitcoin's market cap ($1.4 trillion, March 2026) represents approximately 7% of gold's market cap (~$20 trillion, World Gold Council estimate 2025). If Bitcoin captures gold's store-of-value allocation, the implied price per coin at current supply exceeds $950,000. This mathematical relationship is the basis of several expert $1 million price targets.
Macro variables with demonstrated impact on Bitcoin's price trajectory:
- Federal Reserve rate policy — rate cuts historically correlate with Bitcoin bull runs (2020–2021 example: rates near 0%, BTC +700%)
- U.S. dollar strength — a weakening dollar increases appeal of hard assets including Bitcoin
- Global M2 money supply — expansion historically precedes Bitcoin rallies with a 12–18 month lag, per historical correlation analysis
- Risk sentiment — Bitcoin behaves as a risk-on asset short-term; a digital store-of-value long-term
Market cap figures approximate. BTC supply assumed at ~21M coins. Gold market cap per World Gold Council estimate 2025. Not financial advice.
Risk factors and bearish scenarios
A balanced analysis requires engaging seriously with the risks to the bullish thesis. Market Influencing Factors include unpredictable elements that no model can fully accommodate.
| Risk | Probability | Price impact | Mitigation factor |
|---|---|---|---|
| Coordinated global regulatory crackdown | 15% | –70–90% | Decentralised network; political support growing; China ban failed to permanently suppress |
| Superior technology displaces Bitcoin | 25% | –50–80% | Network effects of 20M+ addresses; $1.4T market cap creates structural moat |
| Macro collapse / global financial crisis | 40% | –50–70% (temporary) | Historically recovers; crisis validates alternative money thesis |
| Security failure (51% attack, protocol bug) | 5% | –90%+ | 15 years without major breach; hash rate at or near ATH; incentive alignment strong |
| Loss of store-of-value narrative | 20% | –30–50% | Multiple use case development; narrative diversifying beyond single thesis |
Volatility remains a structural reality. Every Bitcoin cycle has included at least one drawdown exceeding 70% from prior peaks: –93% in 2011, –86% in 2014–2015, –84% in 2018, –77% in 2022. The current drawdown of approximately 44% from October 2025 highs is, by historical standards, moderate. That does not mean further downside is excluded.
Anyone considering Bitcoin exposure should size positions to accommodate further drawdowns of 50–70% from current levels without requiring a forced exit — not because such a drawdown is likely, but because it is historically precedented and must be within the holder's risk tolerance from day one.
Probability and impact estimates are qualitative assessments. Not financial advice.
Investment strategy based on price predictions
This section translates the scenarios above into analytical frameworks for different time horizons and risk tolerances. None of this constitutes financial advice. Consult a qualified financial advisor before making any investment decisions.
| Strategy | Horizon | Position size guidance | Key principle |
|---|---|---|---|
| Long-term core position | 5–15 years | 2–5% of net worth maximum | Dollar-cost average regardless of price; ignore short-term volatility; never sell allocation |
| Halving cycle positioning | 2–4 years | 5–10% of investable portfolio | Accumulate during MVRV below 1.5; reduce exposure when MVRV exceeds 3.5 |
| Opportunistic positioning | 3–12 months | 1–3% of investable portfolio | Position around technical levels; predetermined exit criteria; tight stop discipline |
Risk management principles:
- Never allocate more than can be afforded to lose in its entirety
- Set exit criteria before entering a position, not after
- Avoid leverage unless liquidation mechanics are fully understood
- Diversify across time horizons rather than concentrating in one entry point
- A 5+ year minimum horizon is appropriate for the long-term scarcity thesis
When executing exchanges during accumulation phases — moving stablecoins to Bitcoin or converting between crypto pairs — comparing rates across providers matters at every transaction. At Swapzone, we aggregate real-time offers from 18+ exchange partners, with each partner's KYC label (Rare / Often / Never), rating, and conditions visible before you send any funds.
Strategy concepts only. Not a buy, sell, or hold recommendation. Consult a qualified financial advisor before making any investment decisions.
Conclusion: the future of Bitcoin pricing
Bitcoin's price trajectory from 2026 to 2050 depends on three structural questions: whether the four-year halving cycle continues to produce predictable supply shocks as block subsidies diminish; whether institutional adoption compounds at sufficient scale; and whether no superior store-of-value alternative displaces Bitcoin's network effects. Expert Predictions that demonstrate range of possible outcomes — from Goldman Sachs's conservative $75–100K for 2026 to ARK Invest's $1M+ by 2030 target — reflect the genuine uncertainty at every timeframe.
The base case across all timeframes assumes halving cycles persist, institutional adoption grows, and no catastrophic protocol failure occurs. Bitcoin Halving Events remain the primary prediction anchor because they are the one input that is fully deterministic — the schedule is fixed in code, the supply math is verifiable, and the historical pattern is documented across four complete cycles.
| Timeframe | Bear | Base | Bull | Key variable |
|---|---|---|---|---|
| 2026 | $55K–$80K | $80K–$130K | $130K–$220K | Macro / ETF flow recovery |
| 2027 | $70K–$110K | $130K–$260K | $260K–$450K | Cycle top timing |
| 2028 | $40K–$70K | $70K–$110K | $110K–$170K | 5th halving support level |
| 2030 | $80K–$130K | $150K–$300K | $300K–$600K | Institutional allocation scale |
| 2035 | $250K–$550K | $550K–$1M | $1M–$2M | Adoption S-curve positioning |
| 2040 | $500K–$1M | $1M–$3M | $3M–$10M | Store-of-value market share |
| 2050 | $1M–$2M | $2M–$5M | $5M–$20M | Global reserve asset question |
Whatever view you hold on Bitcoin's long-term trajectory, executing exchanges at competitive rates matters at every stage of the cycle. At Swapzone, we aggregate real-time offers from 18+ exchange partners — with each partner's KYC label, rating, and conditions visible before you send any funds. Non-custodial (meaning Swapzone holds no user funds): your assets move directly through your selected partner.
| Year | Bear | Base | Bull | Key variable |
|---|---|---|---|---|
| 2026 Post-ATH | $55K – $80K | $80K – $130K | $130K – $220K | Macro / ETF flow recovery |
| 2027 Cycle top Peak yr | $70K – $110K | $130K – $260K | $260K – $450K | Cycle top timing |
| 2028 5th halving Halving | $40K – $70K | $70K – $110K | $110K – $170K | 5th halving support level |
| 2030 Bull cycle Peak yr | $80K – $130K | $150K – $300K | $300K – $600K | Institutional allocation scale |
| 2035 Mid-term | $250K – $550K | $550K – $1M | $1M – $2M | Adoption S-curve positioning |
| 2040 Long-term | $500K – $1M | $1M – $3M | $3M – $10M | Store-of-value market share |
| 2050 Terminal | $1M – $2M | $2M – $5M | $5M – $20M | Global reserve asset question |
Speculative analytical scenarios only. Uncertainty band widens materially beyond 5-year horizons. Not financial advice.
Frequently asked questions about Bitcoin price prediction
Bitcoin's base case for 2026 is $80,000–$130,000, positioned 23 months post-April 2024 halving. Bull case: $130,000–$220,000 if ETF inflows reaccelerate. Bear case: $55,000–$80,000 if consolidation extends. Current price: ~$70,800 (CoinGecko, March 2026).
Bitcoin's base case for 2030 is $150,000–$300,000, reflecting Year 2 post-2028 halving — historically the strongest bull run timing. Bull case: $300,000–$600,000. Bear case: $80,000–$130,000 if adoption slows. All figures are speculative scenarios, not financial advice.
Bitcoin reaching $1 million is plausible in the 2032–2040 timeframe if institutional adoption captures 17% of the global store-of-value market, currently dominated by gold. Bitwise CIO Matt Hougan cited this target publicly on March 11, 2026. Substantial uncertainty applies at all 10-year-plus horizons.
Five market-influencing factors in order of historical importance: halving cycle position (30% weight), institutional adoption via ETFs (25%), regulatory clarity (20%), macroeconomic environment — rates and liquidity (15%), network security and hash rate (10%).
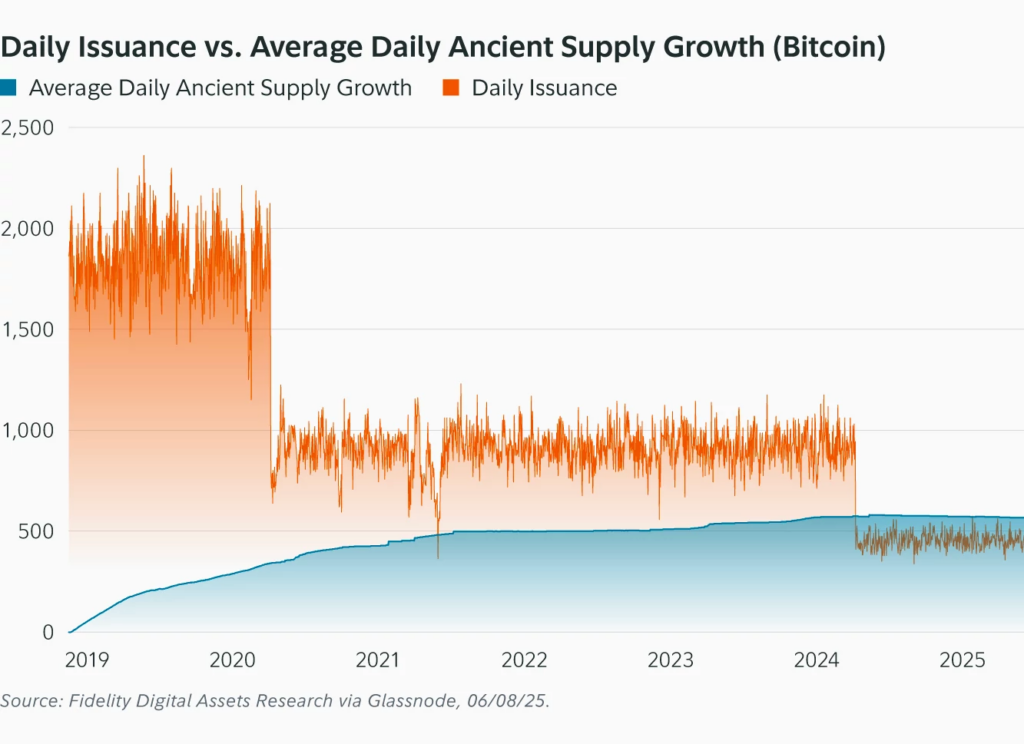
Each Bitcoin Halving Event cuts daily new supply by 50%. The 2024 halving reduced daily issuance from ~900 BTC to ~450 BTC. Historical pattern: price bottoms 12–18 months before each halving, rallies begin 6–12 months after, cycle peaks occur 12–30 months post-halving. Source: CoinGecko research, August 2025.
Bitcoin has compounded at approximately 200% annually since 2009 despite 70–90% drawdowns in every cycle. It functions as a store of value across multi-year horizons, not short-term. A 2–10% maximum portfolio allocation with a 5+ year minimum horizon reflects the risk profile most independent analysts consider appropriate.
Key limitations: 15 years of price history provides limited statistical sample size; all Bitcoin Price Prediction Models assume historical halving cycle patterns continue; black swan events are not modellable; timing precision is substantially harder than directional prediction. Treat all forecasts as scenario frameworks, not financial advice.
MVRV ratio above 3.5 has historically signalled cycle tops within 4–8 weeks; below 1.0 has signalled bottoms. At the 2021 top (~$69,000), MVRV reached approximately 4.0 alongside a surge in exchange inflows. At the 2022 bottom (~$15,479), MVRV dropped to approximately 0.8. Source: on-chain data per Glassnode, 2022.